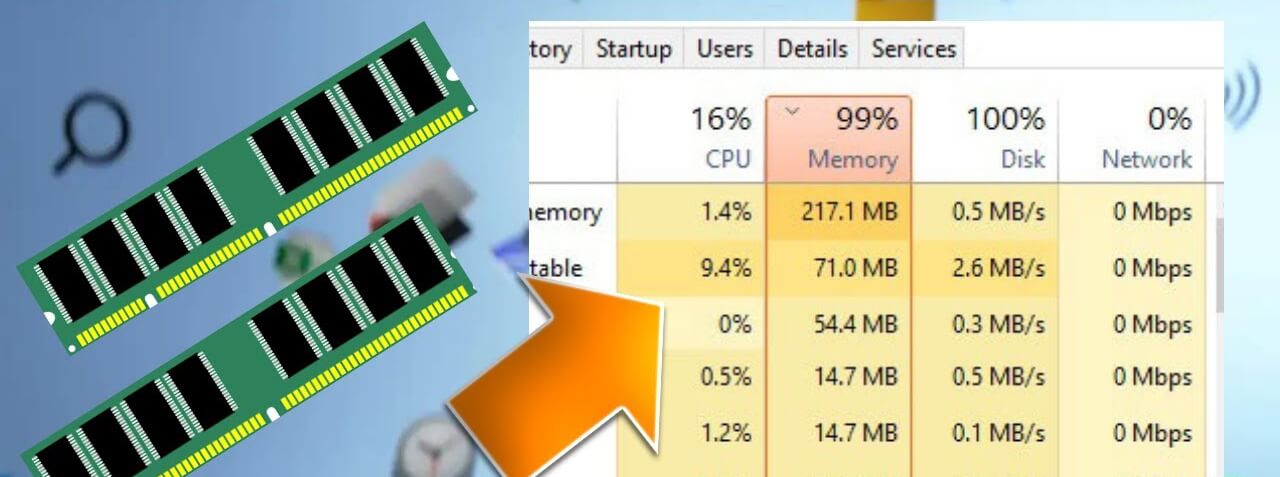
Is your computer running sluggishly because of an unexpected background process? High system memory consumption frustrates users daily. Furthermore, many modern desktop applications rely heavily on embedded browser engines to display web content. Consequently, a hidden WebView2 memory leak can consume your available system resources rapidly. Microsoft designed this framework to render web components efficiently. However, software bugs frequently trigger runaway background processes. Therefore, you must fix high RAM usage quickly to restore desktop performance.
In this comprehensive troubleshooting guide, we examine why Windows 11 system webview containers consume excessive RAM. Additionally, we provide step-by-step solutions to resolve these resource hogging issues permanently. Afterwards, your system will run noticeably faster and smoother.
💡 Pro-Tip: Before modifying system files or reinstalling frameworks, open Windows Task Manager (Ctrl + Shift + Esc). Expand the process tree under any application using WebView2. Thus, you can identify the exact instance causing memory consumption spikes.
Understanding Microsoft Edge WebView2 and System Webview Containers
Microsoft integrated embedded browser technology deeply into the Windows 11 operating system architecture. Consequently, third-party software developers utilize the Microsoft Edge WebView2 runtime to embed web content directly into native desktop applications. Popular applications like Teams, Outlook, Widgets, Spotify, and Discord rely heavily on this framework. Furthermore, building native UI components from scratch requires extensive development time. Therefore, developers wrap web technologies inside desktop shells to streamline application deployment.
Under normal operating conditions, these web containers consume minimal system RAM. However, underlying code errors within host software can disrupt normal garbage collection routines. As a result, orphaned container processes remain active inside system memory indefinitely. Meanwhile, these background tasks continuously accumulate memory allocations without releasing allocated blocks. Eventually, the active msedgewebview2.exe high memory process consumes gigabytes of memory. Thus, your system experiences severe performance bottlenecks and lagging responsiveness.
Common Causes of Windows 11 High RAM Consumption in WebView2
Multiple factors contribute directly to memory leak issues inside web view containers. First, improper JavaScript memory management inside embedded web applications prevents automatic garbage collection. Therefore, temporary data structures persist within system memory indefinitely. Second, corrupted runtime files create infinite processing loops behind the scenes. Consequently, background tasks repeatedly request system memory allocations.
Additionally, outdated graphics drivers conflict directly with hardware acceleration features inside web view containers. Furthermore, third-party security software frequently interferes with container isolation protocols. As a result, system webview container fix procedures become necessary for maintaining operational stability. Knowing these root causes helps you apply targeted solutions effectively.
⚠️ Warning: Never force terminate critical system processes without saving open work. Abruptly killing parent application processes can corrupt cached user configuration data.
Step 1: End Runaway msedgewebview2.exe Processes via Task Manager
First, you should apply a quick immediate fix by terminating the faulty background process manually. Although this action serves as a temporary workaround, it instantly releases locked system memory.
- Press Ctrl + Shift + Esc simultaneously to launch the Windows Task Manager.
- Navigate directly to the Processes tab in the left sidebar.
- Scroll down to inspect the background processes section carefully.
- Locate instances labeled Microsoft Edge WebView2 Process or
msedgewebview2.exe. - Right-click the problematic sub-process consuming high RAM resources.
- Select End task to terminate the isolated web container immediately.
Consequently, the host application will automatically restart its embedded web rendering engine. Therefore, your system RAM usage drops immediately back to normal baseline levels.
Step 2: Repair or Reinstall Microsoft Edge WebView2 Runtime
If memory leakage reoccurs continuously, your local framework files might be damaged. Fortunately, repair mechanisms exist directly within Windows settings to fix corrupted files.
You can execute a complete runtime repair by following these precise steps:
- Press Windows Key + I to open the main Windows Settings panel.
- Click on Apps from the primary navigation menu on the left.
- Select Installed apps to view all installed software packages.
- Type WebView2 directly into the top search query bar.
- Locate Microsoft Edge WebView2 Runtime in the filtered search results.
- Click the three dots menu icon located on the right side.
- Select Modify from the context menu list.
- Click Repair when prompted by the user account control window.
Otherwise, if the repair process fails, you can download the official installer directly from the Microsoft Edge Official Portal. Reinstalling the runtime overwrites broken component binaries clean, ensuring fresh stability.
Step 3: Clear Embedded Application Caches
Web view containers continuously store temporary data, cookies, and cached scripts inside application subfolders. Over time, corrupted cache files trigger loop errors within runtime components. Consequently, clearing application cache folders resolves deep-seated memory leak issues effectively.
For instance, Microsoft Teams and Windows Widgets utilize heavy webview instances. You can reset their cached storage safely without deleting essential account credentials. First, close the affected application entirely from the system tray. Next, open the Run dialog by pressing Windows Key + R. Type %LocalAppData%\Packages into the text bar and press Enter.
Afterwards, locate the specific application folder, such as Microsoft.Teams_8wekyb3d8bbwe or Microsoft.WidgetsPlatformRuntime_8wekyb3d8bbwe. Open the folder and locate the internal LocalCache and EBWebView directories. Delete these cached directories completely. Finally, relaunch your application to regenerate pristine data stores.
Step 4: Disable Hardware Acceleration in Host Applications
Graphics processing unit (GPU) acceleration speeds up web rendering tasks significantly. However, outdated display driver implementations frequently trigger memory leak loops within embedded web engines. Therefore, turning off hardware acceleration offers a practical workaround for unstable environments.
Many desktop applications provide a dedicated toggle switch for hardware acceleration within their preferences menu. Open the settings menu inside your lagging software program. Search for the System or Advanced configuration section. Locate the option labeled Use hardware acceleration when available. Toggle this setting off completely, then restart the application. Additionally, updating your graphics drivers through official manufacturer tools like NVIDIA Driver Downloads or AMD Support & Drivers prevents recurring rendering glitches.
Step 5: Perform Windows System File Checks
Corrupted operating system dependencies can cause system webview containers to behave erratically. Therefore, running native system maintenance tools cleans up underlying platform corruption. Windows 11 high RAM consumption issues often stem from corrupted core libraries. Fortunately, Windows includes powerful command-line utilities designed specifically for system image repair.
First, open the Windows Search bar and type cmd. Right-click Command Prompt and select Run as administrator. Next, execute the following repair commands sequentially, pressing Enter after each input line:
DOS
DISM.exe /Online /Cleanup-image /Restorehealth
sfc /scannow
The System File Checker tool scans all protected system files thoroughly. If corrupted files exist, Windows replaces them automatically using cached system copies. Review detailed system diagnostic procedures through the Microsoft System File Checker Guide to learn more about advanced repair commands.
Proactive Best Practices to Prevent Memory Leak Recurrence
Maintaining a smooth desktop environment requires proactive maintenance routines. You can prevent web view memory issues by adopting consistent software update habits.
- Keep Windows 11 updated through the standard Windows Update utility regularly.
- Update third-party desktop applications frequently to receive critical developer patches.
- Monitor background startup programs to reduce unnecessary active web view instances.
- Restart your computer periodically to clear system page files completely.
Final Thoughts
A persistent WebView2 memory leak degrades system responsiveness and wastes valuable hardware resources. However, following systematic troubleshooting procedures restores optimal performance quickly. By repairing the runtime, clearing application caches, and disabling conflicting settings, you eliminate excess RAM consumption easily. Furthermore, proactive system maintenance ensures your Windows 11 system webview processes operate cleanly without compromising productivity.
Did this troubleshooting guide help you resolve high memory usage on your system? Please leave a comment below sharing which solution worked best for your setup! Don’t forget to share this article with fellow Windows 11 users who need to boost their PC performance.