
Modern artificial intelligence tools have completely transformed how software engineers write, debug, and review code. Consequently, AI-powered code editors like Cursor 3 have quickly gained massive popularity across the global developer community. However, high background resource consumption frequently degrades the overall user experience. Moreover, unexpected language server crashes can instantly halt your active development workflow.
When your computer fan spins loudly, Cursor 3 is likely consuming excessive hardware resources. Fortunately, you can easily fix high CPU usage in Cursor 3 by applying key configuration adjustments. In addition, resolving frequent Cursor AI editor language server crash errors restores coding stability. In this comprehensive troubleshooting guide, we will analyze why these performance issues happen. Furthermore, we will walk you through actionable solutions to regain smooth editing performance.
Understanding Why Cursor 3 Consumes High CPU and Memory
Before implementing technical fixes, you must identify what causes system resource exhaustion. Because Cursor 3 relies on the Electron framework, it manages multiple background processes simultaneously. Specifically, the AI indexing engine scans millions of codebase lines to build semantic context vectors. Consequently, unrestricted file indexing overloads your system processor.
In addition, third-party extensions often conflict directly with built-in AI capabilities. For instance, running multiple AI helpers creates continuous background background threads. Similarly, keeping ultra-long chat sessions active forces the rendering engine to process massive text logs. Eventually, these heavy operations trigger a Cursor 3 memory leak solution requirement or crash language servers entirely.

Step 1: Diagnose Active Processes using Built-in Tools
First, you must pinpoint the exact process consuming your system resources. Rather than guessing, use the built-in diagnostic tools inside the editor.
- Open the command palette using
Ctrl+Shift+P(orCmd+Shift+Pon macOS). - Type and select Developer: Open Process Explorer.
- Inspect the active processes to locate heavy CPU or RAM usage.
Usually, you will see specific sub-processes taking up hardware resources. Look closely at the extensionHost, the rg (ripgrep) file search tool, and the Cursor Helper renderer process. If the extension host process shows abnormal activity, third-party plugins are likely causing the bottleneck. You can monitor real-time extension activity by visiting the official VS Code Performance Documentation for deep troubleshooting standards.
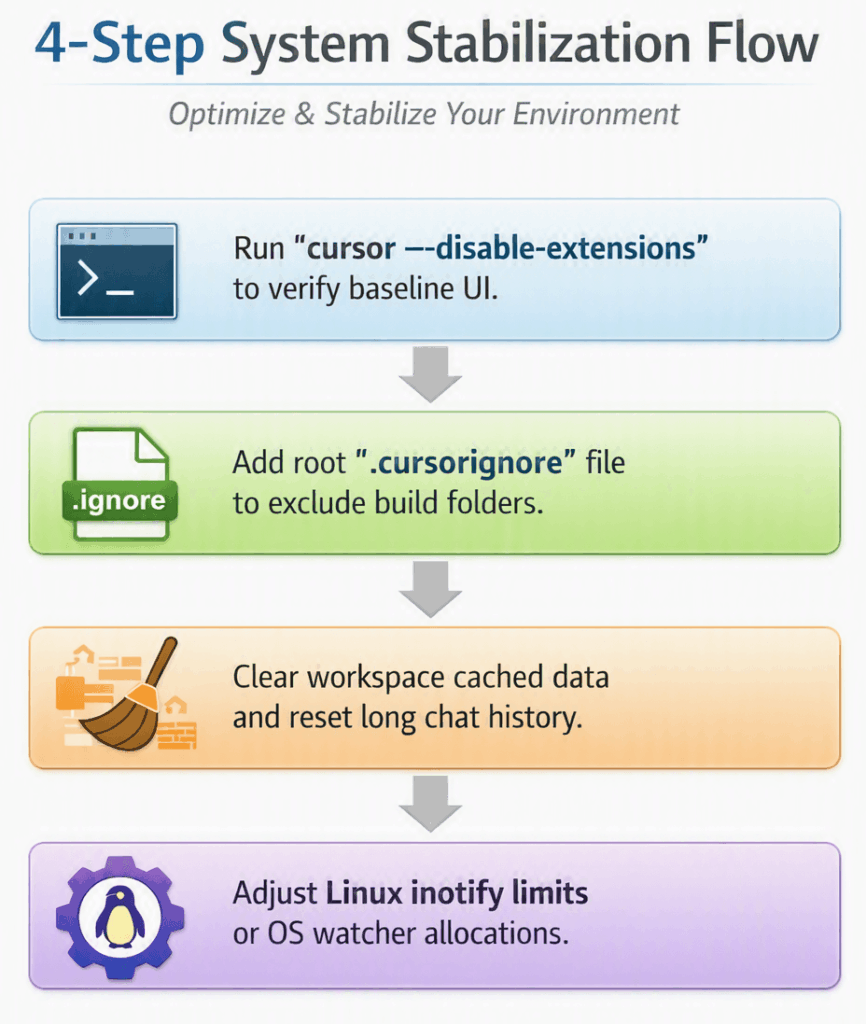
💡 Pro-Tip: Always launch Cursor 3 from your command terminal using the command cursor --disable-extensions. If your high CPU usage drops immediately, an installed extension is definitely causing the problem.
Step 2: Configure a Strict .cursorignore File
By default, the AI agent attempts to index every single file inside your open project directory. Consequently, large directories like node_modules, build outputs, and vendor logs trigger continuous CPU spikes. Therefore, proper Cursor 3 performance optimization requires a configured .cursorignore file.
To implement this fix, create a new file named .cursorignore at your root project folder. Next, add paths that the AI engine should ignore during background scanning:
Code snippet
# Exclude build artifacts and dependencies
node_modules/
dist/
build/
.next/
vendor/

# Exclude large binary and log files
*.log
*.sqlite
*.tar.gz
*.iso

# Exclude coverage reports
coverage/
.git/
By excluding these massive folders, you dramatically reduce background file watcher activity. As a result, the editor stops wasting CPU cycles on irrelevant data. You can read more about file pattern rules on the official GitIgnore Documentation.
⚠️ Warning: Omitting .cursorignore on monorepo structures with over 50,000 files will cause severe system freezing and language server timeouts.
Step 3: Audit Extensions and Eliminate Resource Conflicts
Third-party extensions provide incredible utility for daily developer tasks. However, stacking multiple AI coding tools together triggers major system instability. For example, running extensions like Claude Code or ChatGPT alongside Cursor’s native Composer causes massive process overlapping. Furthermore, these overlapping extensions rapidly exhaust system memory allocations.
To resolve this issue, perform a systematic Cursor extension host high CPU fix audit:
- Open your Extensions tab (
Ctrl+Shift+XorCmd+Shift+X). - Disable redundant AI tools, linters, and heavy syntax checkers.
- Keep only necessary language packages for your active workspace.
- Utilize VS Code workspace profiles to load extensions selectively.
To learn more about optimizing your extension setup, check out the comprehensive VS Code Extension Marketplace Guide.
Step 4: Manage AI Chat History and Clear Cached Data
Long chat threads accumulate massive amounts of conversational context over time. As your chat history expands, the rendering process struggles to manage memory structures. Eventually, this UI burden leads to laggy scrolling, typing delays, and app crashes.
Therefore, managing your conversation history is essential for long-term editor health.
- Close long-running chat windows once a task is finished.
- Start new empty chat threads regularly to reset the UI context buffer.
- Fully restart Cursor 3 so it clears active temporary buffers.
Additionally, corrupted cache files frequently cause background language server failures. Consequently, wiping out stale workspace storage restores pristine editor state.
For macOS users, delete cached data folders via terminal:
Bash
rm -rf ~/Library/Application\ Support/Cursor/Cache/
rm -rf ~/Library/Application\ Support/Cursor/CachedData/
For Linux users, run these commands:
Bash
rm -rf ~/.config/Cursor/Cache/
rm -rf ~/.config/Cursor/CachedData/
For Windows users, navigate to %APPDATA%\Cursor and manually clear the Cache directory. For deeper details on how file systems manage temporary cache storage, consult the Microsoft Storage Documentation.
Step 5: Adjust File Watcher and Inotify Limits
On Linux operating systems, file watchers monitor disk changes in real-time. However, the default system limit for watched files is often too low for modern web projects. When Cursor 3 exceeds this threshold, the language server loses synchronization and crashes repeatedly.
Luckily, you can increase system file watcher capacity permanently. Check your current limit using your terminal:
Bash
cat /proc/sys/fs/inotify/max_user_watchesIf the value is lower than 524288, update your system configuration:
Bash
echo "fs.inotify.max_user_watches=524288" | sudo tee -a /etc/sysctl.conf
sudo sysctl -p
After applying these system settings, Cursor 3 can monitor large project trees smoothly. Furthermore, your language server will remain stable without exhausting CPU resources. If you want to learn more about Linux system administration, review the official Ubuntu Kernel Documentation.
Final Thoughts
Troubleshooting performance bottlenecks in modern developer tools requires a structured approach. By systematically identifying high CPU triggers, you can restore fast coding performance quickly. First, isolate heavy processes using the built-in Process Explorer. Next, limit background indexing by implementing a proper Cursor .cursorignore setup guide strategy.
In addition, audit installed extensions to avoid resource conflicts between competing AI tools. Also, clear stale workspace caches and start fresh conversation threads regularly. Finally, ensure your operating system file watcher limits support large codebase structures. Following these straightforward steps will keep your Cursor 3 environment responsive, efficient, and stable.
Did this troubleshooting guide help you fix your Cursor 3 performance issues? Share your experiences in the comments section below! Do not forget to subscribe to Technical Forum for the latest developer guides, hardware reviews, and software optimization tutorials.